Overview
ZeroToOne is a desktop fitness planner and tracker application used for monitoring and gaining insights into your personal fitness. The user interacts with it using a CLI, and it has a GUI created with JavaFX. It is written in Java, and has about 26 kLoC.
Summary of contributions
-
Major enhancement: Add graphical analysis of workout performance
-
What it does: allow users to generate performance metrics over a time period such as total workout time and average workout time per day.
-
Justification: Allows users to monitor progress made over time in an engaging in and graphical method.
-
Highlights: This feature allows users to specify the time period to analyse. Also, designed to be extensible and allows for more metrics and data points to be added in the future.
-
-
Major enhancement: Add log viewer tab
-
What it is: the log tab that allows users to view their past completed workouts as well as find and delete workouts.
-
Justification: Users need a place to go to manage and track their completed workouts.
-
Highlights: Pretty user interfaces which clearly shows the user the timings of each set as well as whether it was skipped or completed.
-
Minor enhancement: Increased code coverage from 56% to 69%
-
-
Code contributed:
-
Other contributions:
-
Project management:
-
Documentation:
-
Community:
-
PRs reviewed: 24+ reviews
-
Contributed to forum discussions: #101
-
-
Tools:
-
Integrated a third party library (FontAwesome) to the project (184)
-
Setup the initial Github Organization
-
Manage and administer Github Repository (Permissions and branching workflow)
-
Integrated a new Github plugin (TravisCI) to the team repo
-
Added pre-push and commit git hook to run CI checks for the entire team
-
-
Contributions to the User Guide
Given below are sections I contributed to the User Guide. They showcase my ability to write documentation targeting end-users. |
Managing Your Session Logs [Liow Jiachen]
Well done, you have successfully gone through the whole process of setting up your workouts, scheduling them and even logging the workout. In addition to all these cool features, ZeroToOne also allows you to manage your workout log history and even provides you with meaningful statistics to help you track your current progress to help you hit all those fitness goals.
Viewing your logs
To view a list of all your logged completed workout sessions, simply type the following command:
log list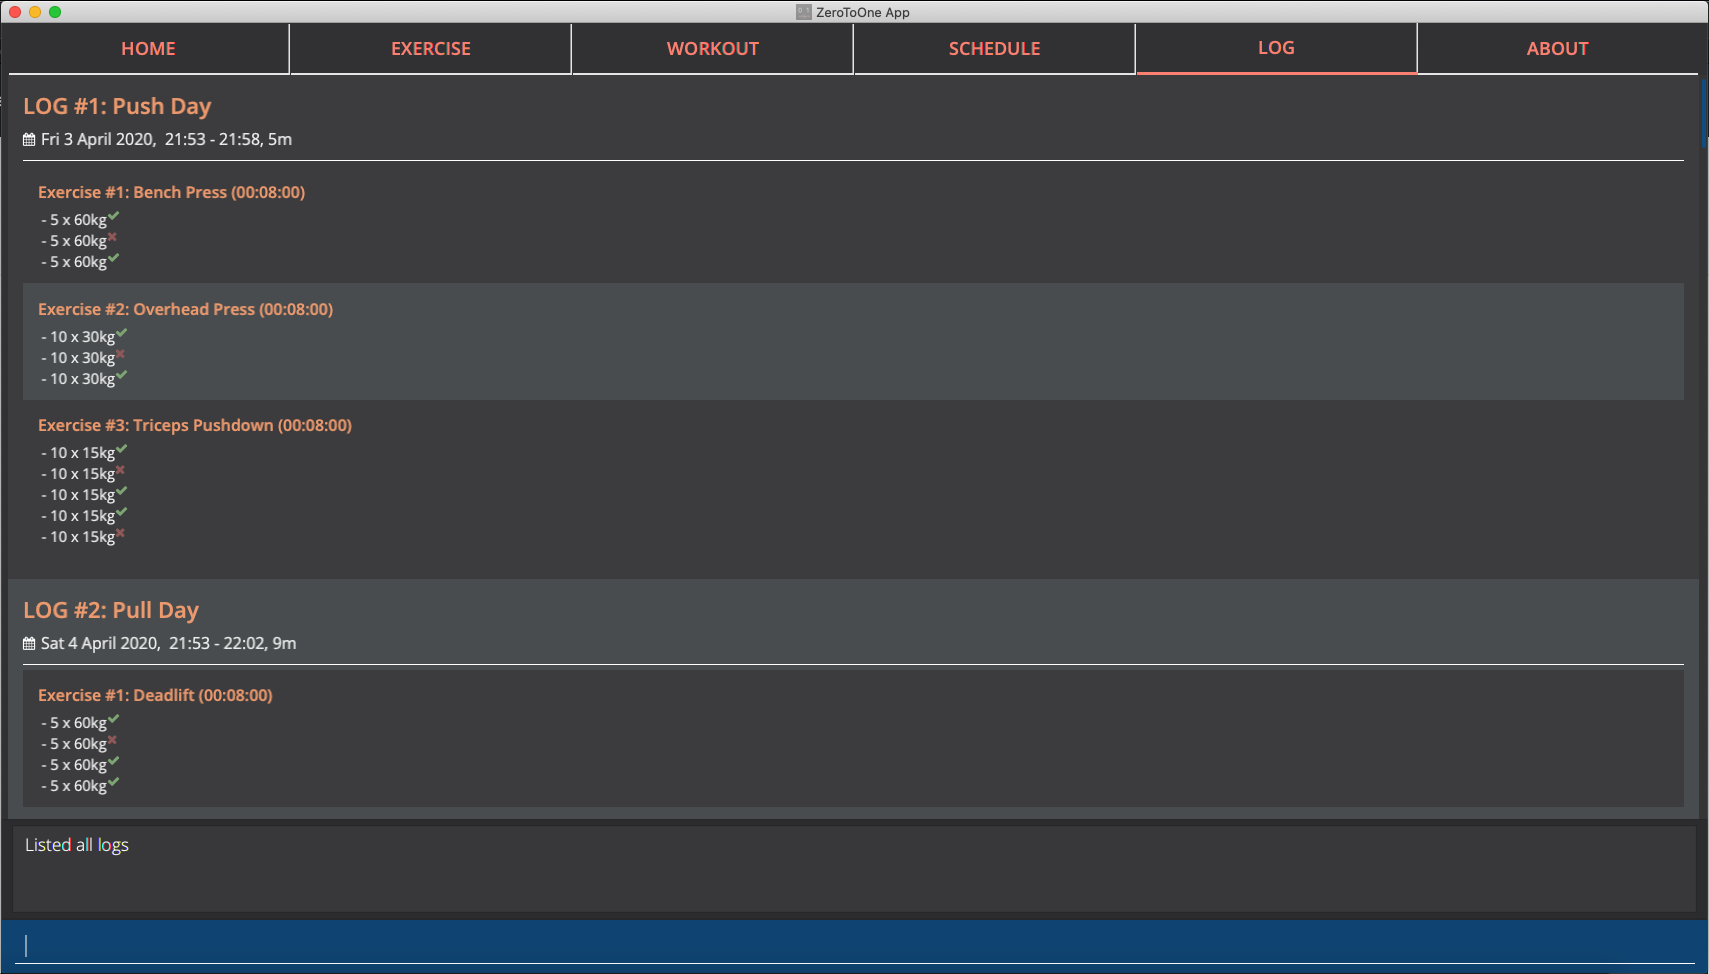
ZeroToOne will display a list of all the logged workout sessions you have carried out. Here, you can see all the logged sessions as well as their corresponding log ID number.
Filtering your logs
We understand that viewing too many logs at once can be confusing at times, so finding a particular log can be difficult. In order to filter your logs by a search query, simply type the following command:
log find [st/<datetime>] [et/<datetime>] [e/<exercise_name>]Example uses:
log find st/2020-04-27 10:10
log find et/2020-04-27 10:10
log find st/2020-04-04 10:10 et/2020-04-05 10:10
log find w/Arms Day
log find w/armsZeroToOne will return a list of all the logged workout sessions that matches either the start_time, end_time or whose workout_name contains the workout name you have typed into the command. From this command, you will be able to see the details of the logged session(s) being searched for. If this is successful, the following message will be displayed in the feedback display:
Listed 1 logged workout sessions(s) found!Deleting a log
Want to delete a log? Simply type in the following command:
log delete LOG_IDExample use:
log delete 1The view will automatically update with the updated list of logged sessions. If this is successful, the following message will be displayed in the feedback display:
Successfully deleted log: Legs Day on 1 April 2020, 21:50, WedNOTE:
* LOG_ID refers to the index of the log as viewed on the screen
* This include results returned through the find commandDisplaying progress in workout logs
To view your progress in a graphical view over a particular time period, simply type the following command:
log display [st/<start_time>] [et/<end_time>]Example use:
log display
log display st/2020-04-01 10:10
log display st/2020-01-01 00:00 et/2020-02-01 00:00NOTE:
* Statistics will considered ALL entries in range between <start_time> and <end_time> inclusive
* If <start_time> is omitted then logs will be considered regardless of their start timings
* If <end_time> is omitted then logs will be considered regardless of their end timings
* If both <start_time> and <end_time> are omitted then ALL logs will be considered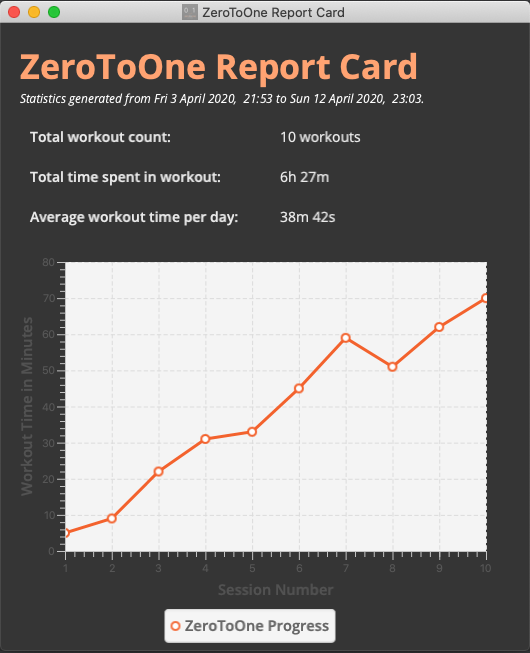
ZeroToOne will display a graphical line chart that depicts your overall progress. This means you can quickly see at a glance how successful you have been in completing your sessions. This can help motivate you to work harder to improve, or continue maintaining your progress.
Here is a list and explanation of the metrics provided:
| Notation | Description |
|---|---|
Total Number of Workouts |
The number of successfully completed workouts |
Total Time Spend |
The total sum of time spend in all the workouts |
Average Time Per Day |
The amount of time spent on average per day |
Contributions to the Developer Guide
Given below are sections I contributed to the Developer Guide. They showcase my ability to write technical documentation and the technical depth of my contributions to the project. |
Log Statistics [Liow Jiachen]
The log statistics feature in ZeroToOne allows users to view their completed workouts visually with meaningful aggregated information so they can see how much progress made.
Overview
The ZeroToOne user can generate and view these statistics via the log display command which takes in two optional parameters startRange and endRange. Workouts will only be considered if they fall within the startTime and endTime range.
Architecture
The log statistics feature was built from the ground up with modularity and extensibility in mind which is inline with SLAP and SOLID principles. This is exemplified in the decision to have a DataPoint abstract class. The class diagram is shown below.
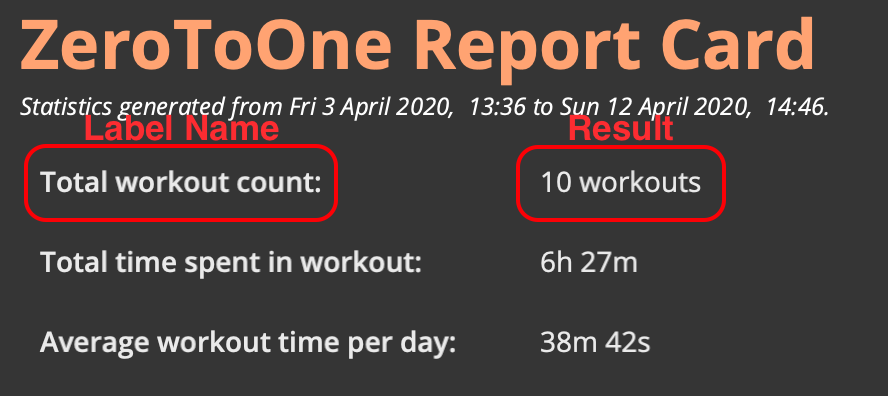
A DataPoint is metric that takes gives the user some information on his or her performance. Data points are list row by row to the user with the labelName on the left followed by the result on the right in a table format.
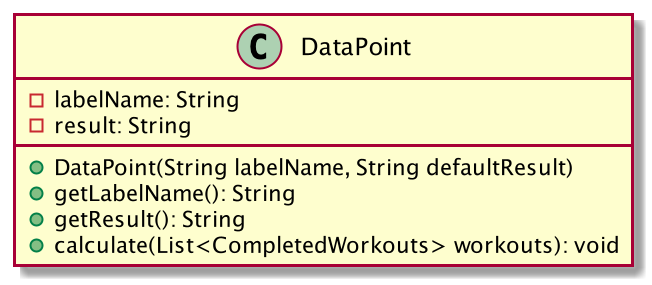
This abstract class is then extended by concrete class as shown below.
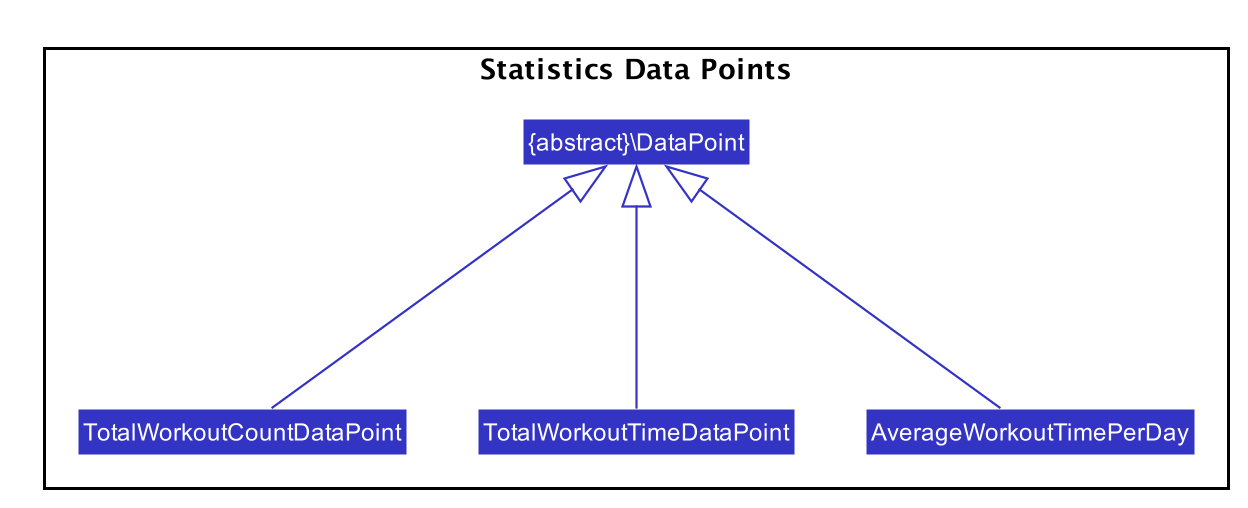
Through this abstraction we make it easy to extend and include new metrics to track in the future. All that needs to be done is to create a new class that extends DataPoint and implements the calculate function that takes as input a list of CompletedWorkout and does the necessary calculations and sets the results.
Implementation
To help explain the implementation of this feature, this portion of the developer guide will examine the command execution of the log display command.
For the sake of clarity, this portion of implementation has been broken down into two phases.
Phase 1 will primarily deal with the actual command parsing, execution and the storing of the startRange and endRage in the model while Phase 2 will then go on to generate statistics based on the startRange and endRange provided in phase 1.
Execution Phase 1
The sequence diagram below describes the flow when the log display command is invoked by the user.
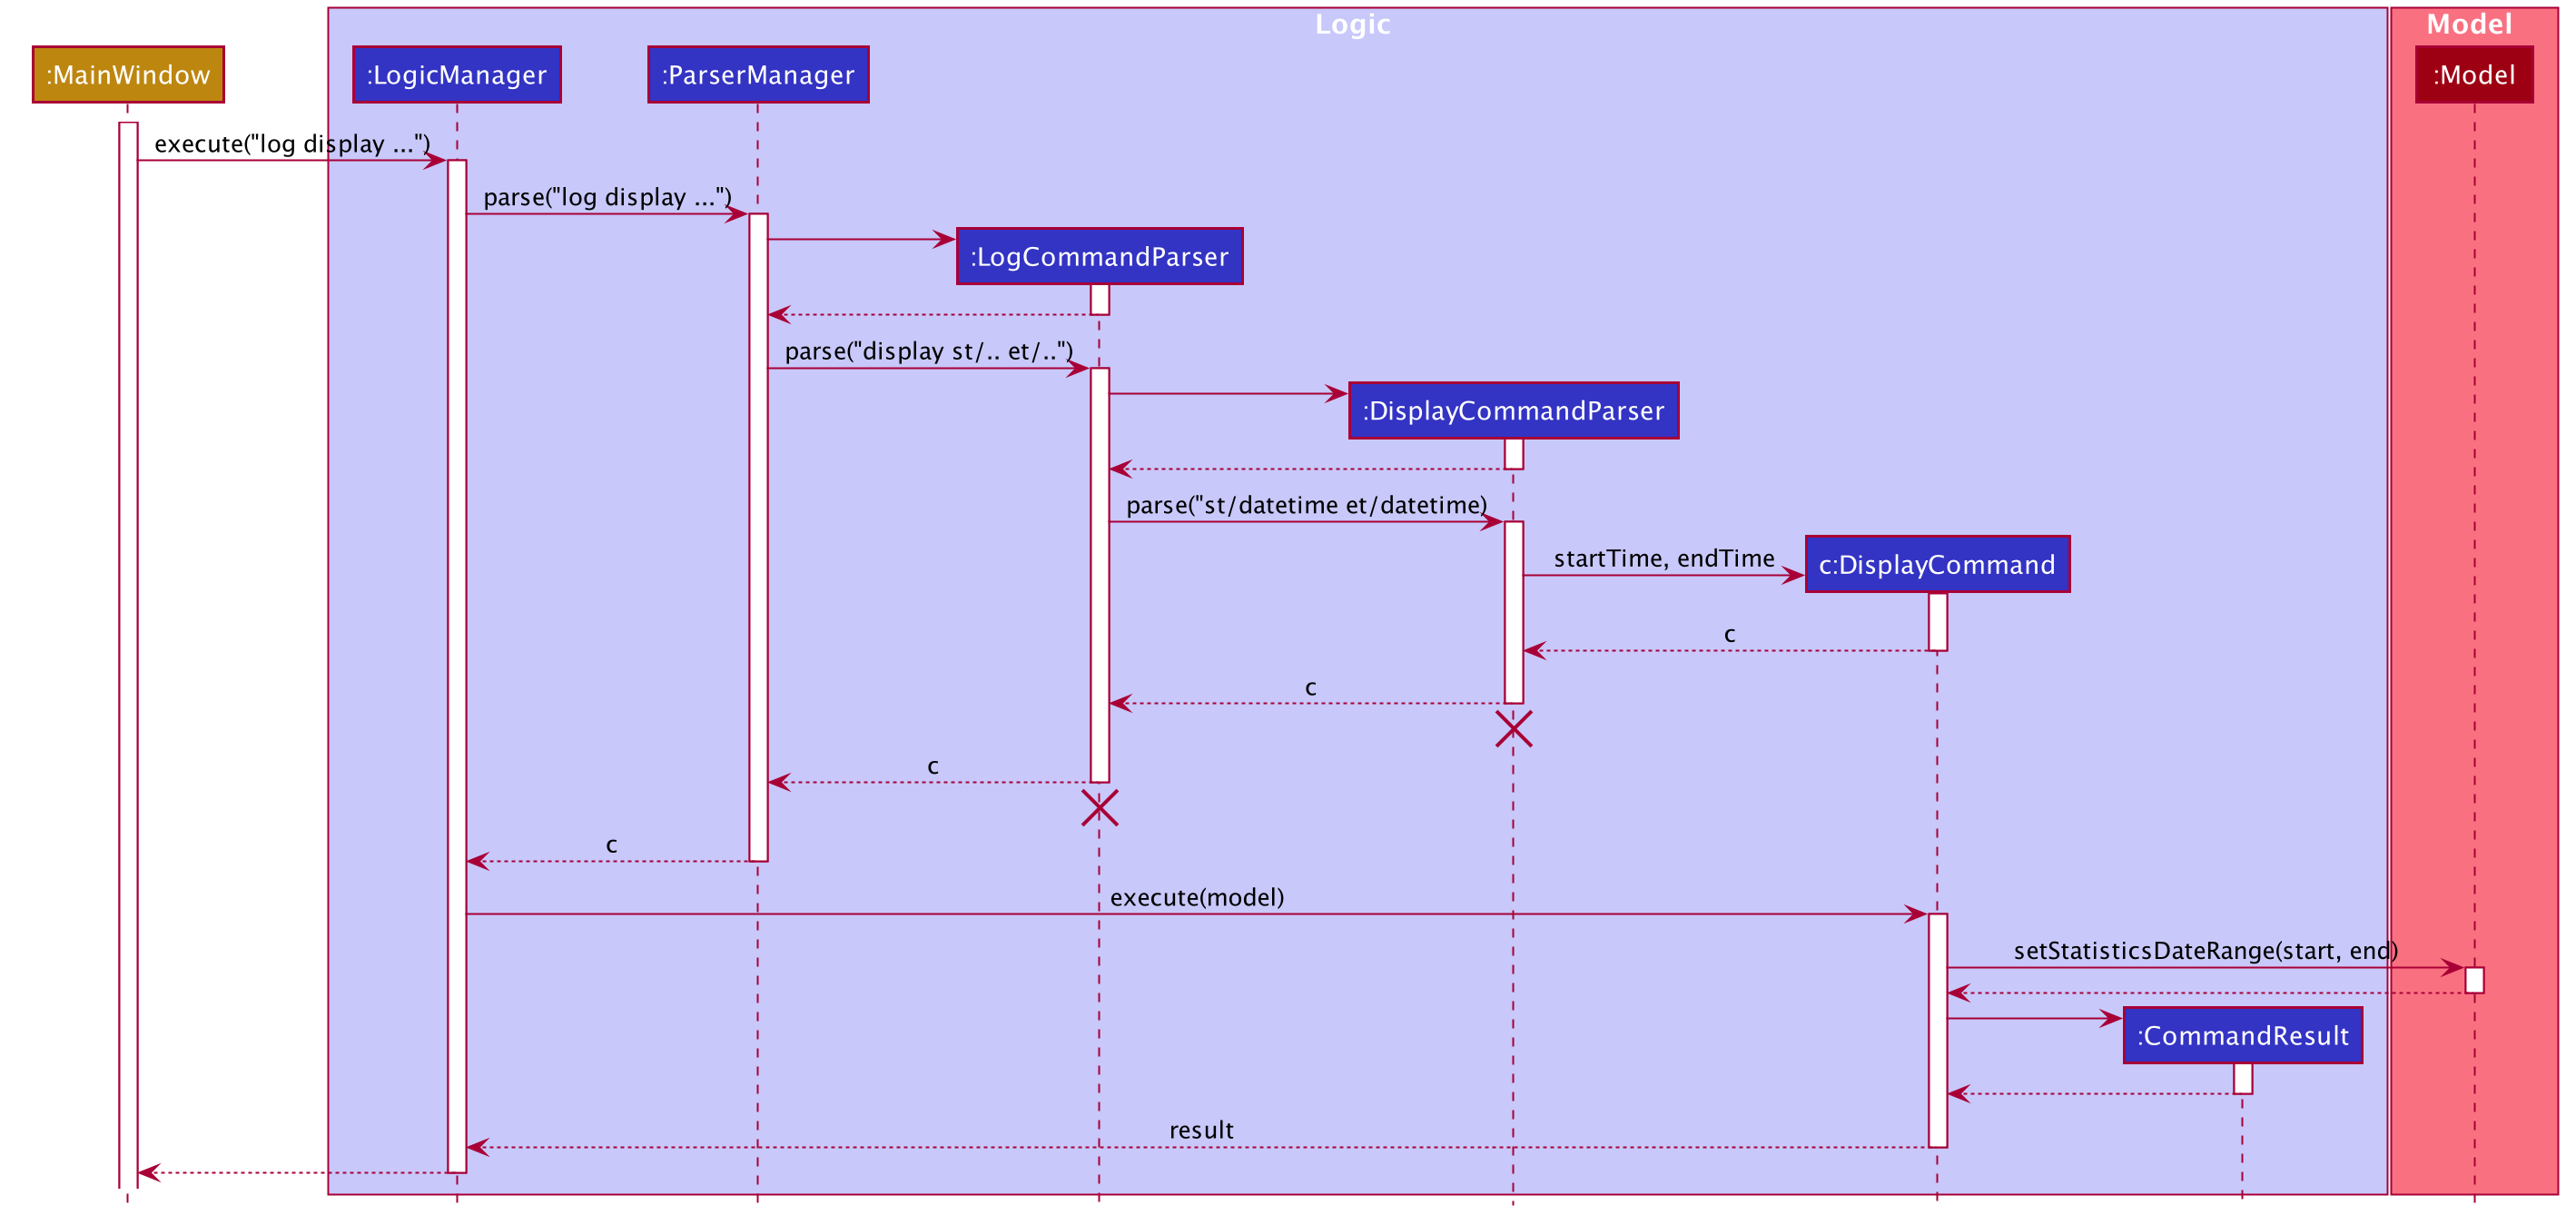
This next section goes over in a little more detail how the program unfolds.
Step 1: When the user enters the log display command, the MainWindow#executeCommand() is executed and in turn calls on the LogicManager to help with this.
Step 2: The LogicManager then goes through with the normal flow of parsing the command and its parameters and then returning a valid DisplayCommand. This section will not go into details and specifics of this process as it has already been covered above.
Step 3: Once the Logic Manager receives the DisplayCommand, it will call the concrete implementation of the DisplayCommand#execute(Model model) to run the command with the current model.
Step 4: The execute function will then go ahead and store the startRange and endRange in the model via the Model#setStatisticsDataRange function.
Step 5: This is where the display command differs from all the other commands. When constructing the CommandResult to be returned, the showReport flag in CommandResult is set to True.
Summary:
startRange and endRange are updated in the current Model
The showReport flag in CommandResult being returned is set to True
ExecutionPhase 2
Following immediately from phase 1, phase 2 will commence with the return of CommandResult to the MainWindow#executeCommand function. The sequence diagram below documents the execution flow.
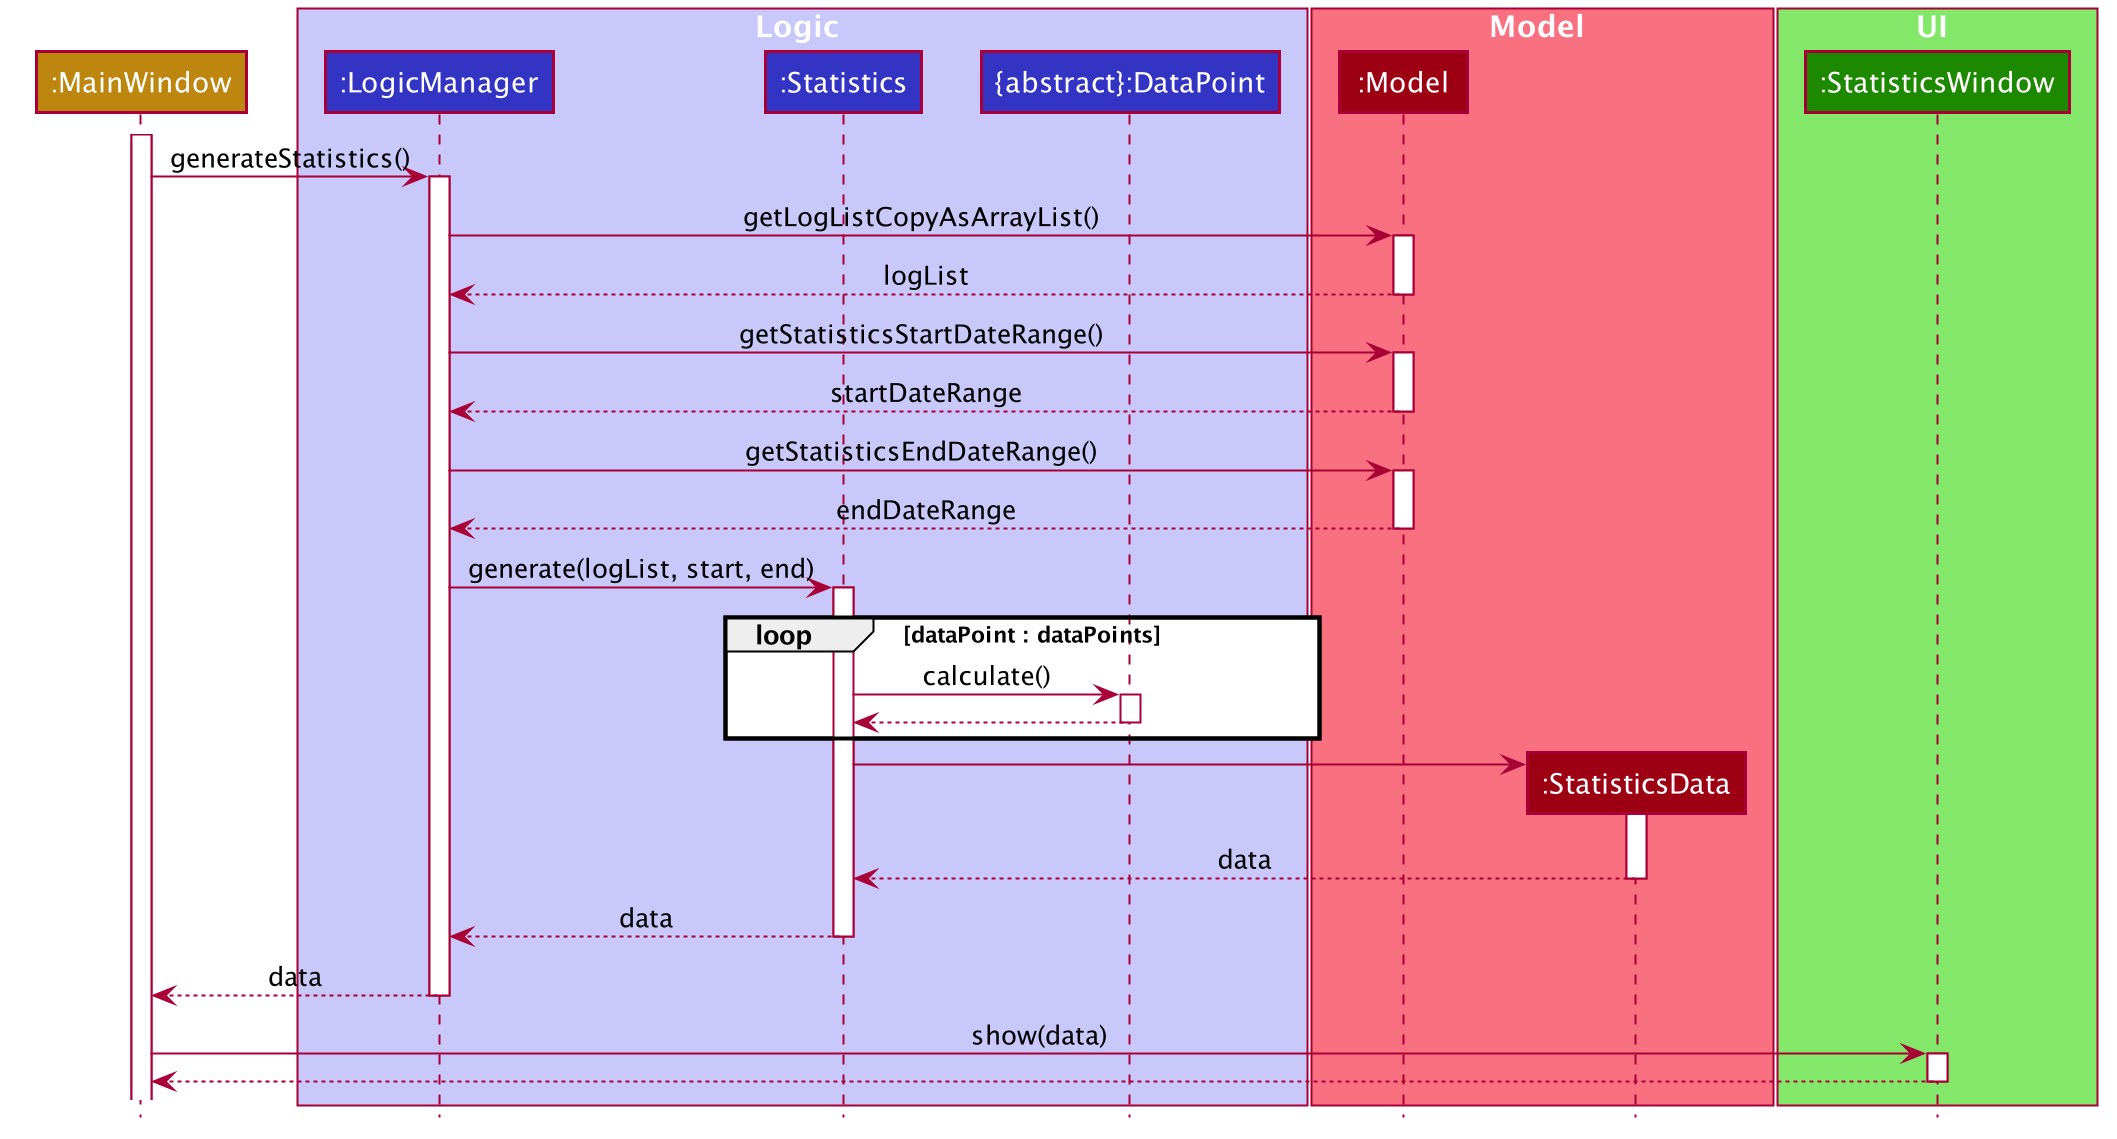
Similar to phase 1, this next section will detail the steps taken in a little more detail.
Step 1: When CommandResult is returned to the main window, it is checked for the showReport to decide if the report page should be shown.
Step 2: Since the showResult flag will be set to True, the MainWindow will call LogicManager#generateStatistics to help with the generating of the statistics.
Step 3: The LogicManager will then query all the information it requires from the model including the startRange and endRange described in phase 1.
Step 4: Next, the static function Statistics#generate will be invoked. This function will then instantiate new instances of all the DataPoints configured.
Step 5: Once instantiated, the DataPoint#calculate function will be invoked on all the DataPoint objects. This used to calculate and populate each data point with valid data from the list of workouts.
Step 6: Once this is done, a new StatisticsData object is created with the data points and the list of workouts and returned.
Step 7: Lastly, the view StatisticsWindow#show function is called with the StatisticsData previously returned. This renders the new window with the computed statistics.
Design Considerations
The following section will detail some of the design consideration and design choices we made while implementing the log statics feature.
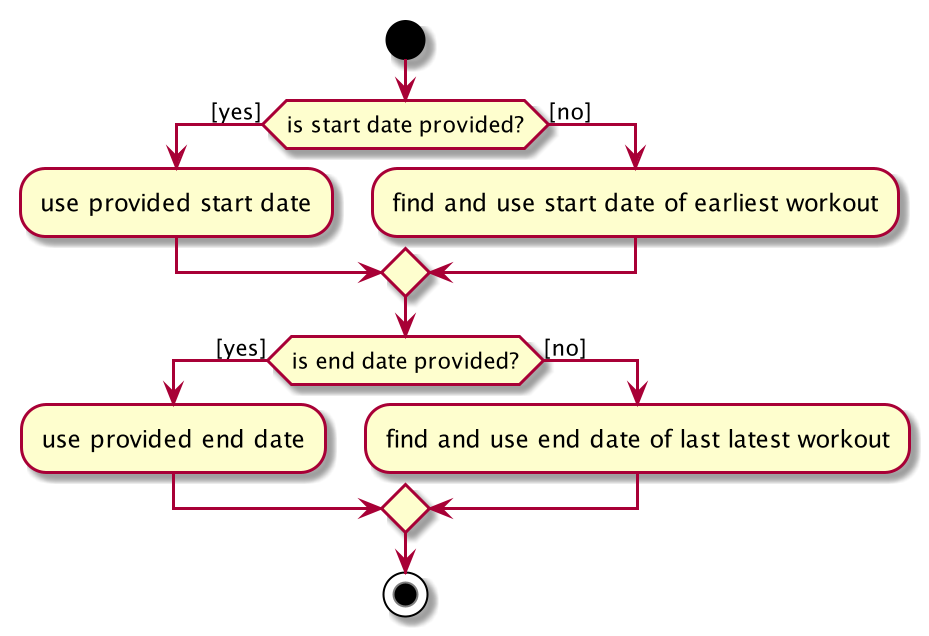
Flexibility and Sensible Defaults
We wanted to build the statistics feature to be flexible. This is why we decided to include a startRange and endRange to the log display command. This allows users to generate reports for custom datetime ranges.
Due to this flexibility we had to think hard of sensible defaults for this date range if they were not specified. We eventually decided on the flow specified by the activity diagram below.
-
Alternative 1: Do not support date range in log command
-
Pros: Easy to implement.
-
Cons: Less flexible and metrics used will be limited.
-
-
Alternative 2 : Require
startRangeandendRangein all display commands-
Pros: Would have to consider sensible defaults
-
Cons: More for the user to type if he/she wants to view statistics over all workouts.
-
-
Alternative 3 : Allow optional
startRangeandendRangeuse start of epoch for start time and current datetime for end date.-
Pros: Easy to implement
-
Cons: Statistics generated using the number of days might not make sense. [Note] For example, the average workout time per day would not make sense since the number of days since epoch will be huge.
-
-
Alternative 4 (current choice): Allow optional
startRangeandendRangeand if not given take earliest start date time and latest end datetime-
Pros: More meaningful metrics and statistics
-
Cons: More complicated model and defaults might not seem intuitive at first
-
Defensive Programming
We decided to build these features with security at the forefront. This can be seen in
-
The use of optionals and
ifPresent()functions guards againstNullPointerExceptionswhen the user does not provide optional fields. -
requireNonNullare frequently used to check fornullvalues. -
Strong exception handling when parsing
startRangeandendRangein the display command and throwing aParseCommandExceptionif date times provided are not valid in the specified format.